Results
In order to evaluate our method we used the benchmark datasets published by
Rye et al., 2011.
They have analyzed CHIP-seq reads of three transcription factors, namely MAX, NRSF and SRF, using five peak finders. Some of the peaks obtained from the applications were visually
investigated by the authors and the peaks were classified as True Positive, False Positive and Ambiguous.
In our analysis we applied all the seven peak finders included in PFMS to the three transcription factors
datasets with the background data. The same way we ran PFMS with various combinations of parameters and peak finders.
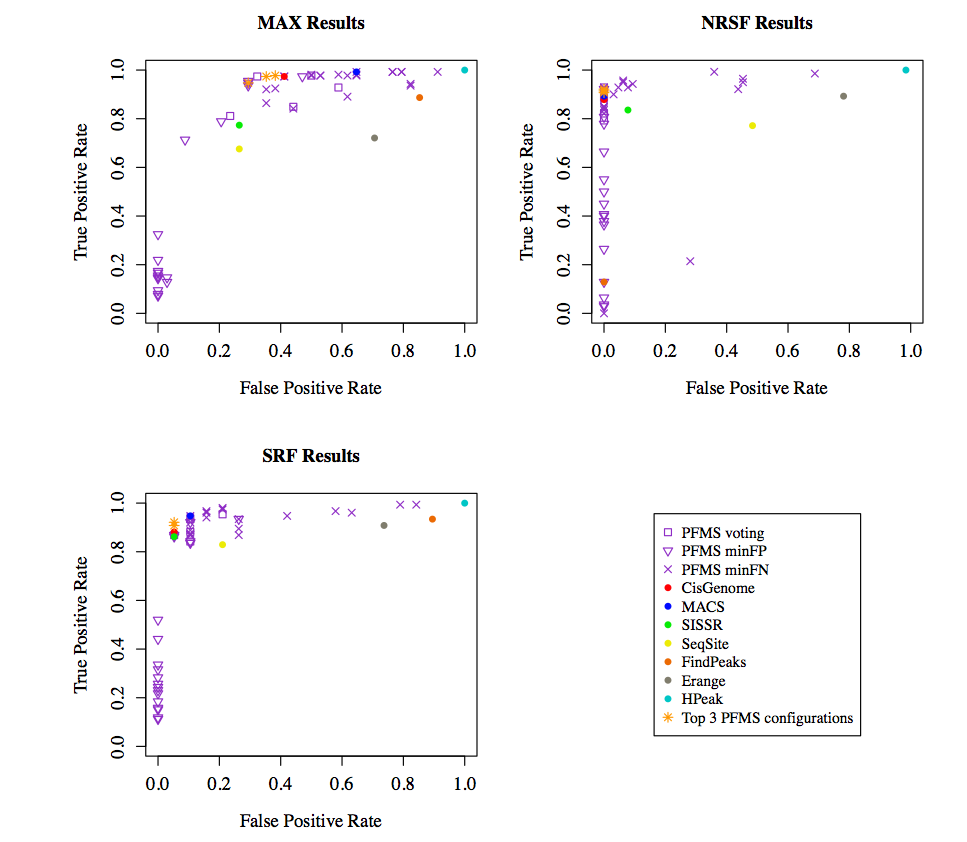
ROC curves for the results comparing the performance of all the methods are shown below.
 |
As it is shown in the figures above, PFMS outperforms the individual runs of all the peak finders.
It is recommended to use the PFMS with MACS, CisGenome and SISSRs under the voting mechanism as this setting provides the best results overall.
Click all resutls to get results of the combinations shown in the figue above.
Depending on the user's aim, the specificity can be controlled using the min rank parameter. In addition to the results of PFMS, the results of each peak finder were also stored separately and compred to the resutls of the rye et al.
As it can be noticed beside the option to get the most consensus peaks, PFMS can also be used as a gateway to run the selected peak finders and get their results.
